
| Criteria | Include | Exclude |
|---|---|---|
| Population | All patient groups undergoing a surgical procedure | Patients not undergoing surgical procedures. Non-human studies |
| Concept | Studies using a total opioid burden metric as a primary or secondary outcome (Such as oral morphine equivalence (OME), milligram morphine equivalence (MME) or opioid equivalence) | Outcomes not including opioid totals |
| Context | Patients undergoing surgical procedures | Palliative care studies or Pharmacology studies |
| Other | Any studies comparing a control against and intervention or two interventions. |
Supplementary material C — Exploratory Literature Search
C.1 Introduction
Given the mathematical proof and the results of the simulation, an exploratory search of the literature was performed to establish a formal systematic literature search protocol. The intention of the literature search is to understand to what extent does the current literature describe TOB methodology and if it was possible to estimate the bias in published works. To formally calculate the bias the error in the conversion value is needed which requires the knowledge of the biological ground truth. As this is not possible, a range of different conversion values, each with their own unknown error was used to as a proxy for a range of conversion value errors.
C.2 Methods
A informal search of literature to understand the use of opioid equivalence metrics in peri-operative and surgical studies published in 2025 was performed. A search of the PUBMED database was performed on 7th July 2026 using the following search string.
NotePUBMED search term
((((((“opioid equivalent” OR “oral morphine equivalence” OR “oral morphine equivalent” OR “oral morphine equivalents” OR “OME” OR “morphine milligram equivalents” OR “morphine milligram equivalence” OR “MME” OR “morphine equivalent daily dose” OR “MEDD”) AND (“perioperative” OR “peri-operative” OR “postoperative” OR “post-operative” OR “surgical” OR “surgery” OR “post-surgical” OR “postsurgical”))) AND (“2025/01/01”[Date - Publication] : “2025/12/31”[Date - Publication]))) AND (“clinical trial”[Filter] OR “clinical trial” OR “controlled clinical trial” OR “randomized controlled trial” OR “interventional” OR “intervention study” OR “clinical trials as topic”[MeSH Terms] OR “cohort studies”[MeSH Terms] OR “cohort” OR “prospective” OR “retrospective” OR “case-control” OR “comparative study” OR “evaluation study”))
Primary and full text screening was carried out using the inclusion criteria detailed in Table C.1 by one author.
Papers where ordered randomly within the Covidence platform and data was extracted from a random subset by a single author as presented by the platform1. Primary Data extraction was performed using a drop down selection proforma including study design, methodology and reporting of total opioid metrics. Free text notes were collected to aid secondary data collection.
For each paper where group average doses of each opioid were described, these were extracted. If only median values were provided, an estimated mean was calculated using Wan’s 2014 approximation (\(\hat{d_i} = \frac{Q_1 + M + Q_3}{3}\) ) to preserve the linearity with in the arithmetic mean2. Where opioid routes where not provided then IV was assumed and where conversion values were not provided, the Nielsen set was used3.
The group mean of total opioid burden reported by the paper was extracted. Then using the mean doses and the conversion values provided, the group mean was calculated independently. Following this, all possible group means were calculated by applying each of the possible values provided in Table 1 of Neilsens Conversion set (summarised in Table C.2), as the range of plausible conversion values an author may use3.
| Medication | Conversion values |
|---|---|
| morphine | 2 |
| fentanyl | 100, 150, 200, 300 |
| oxycodone | 3 |
| tramadol | 0.1, 0.2, 0.25 |
| hydromorphone | 15, 20 |
| hydrocodone | 1, 1.33 |
C.3 Results
C.3.1 Reporting of opioid burden metrics
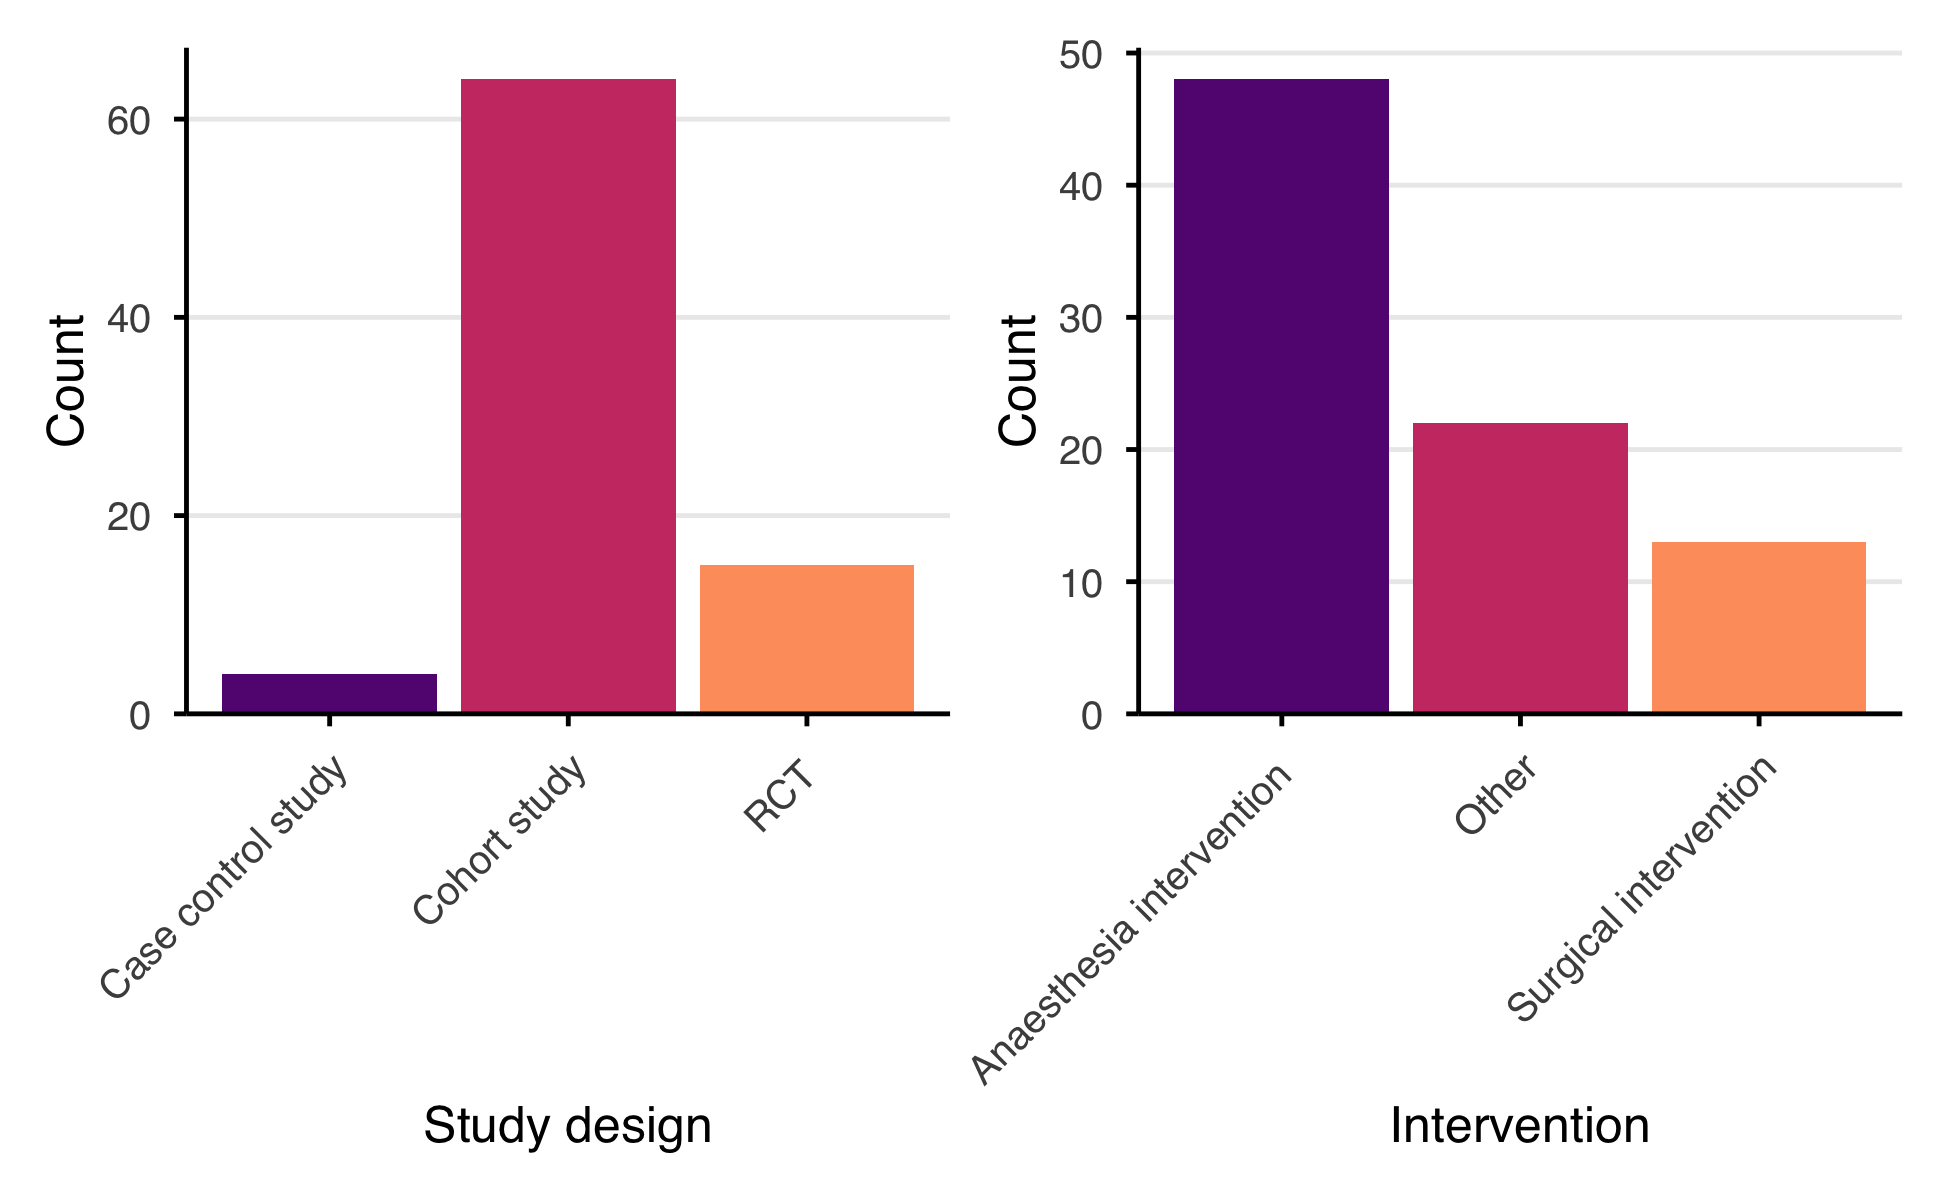
480 studies were identified in the rapid literature search, a sample of 83 that fit the eligibility had data extracted. The majority of studies were cohort studies and most common intervention was anaesthetic interventions (Figure C.1).
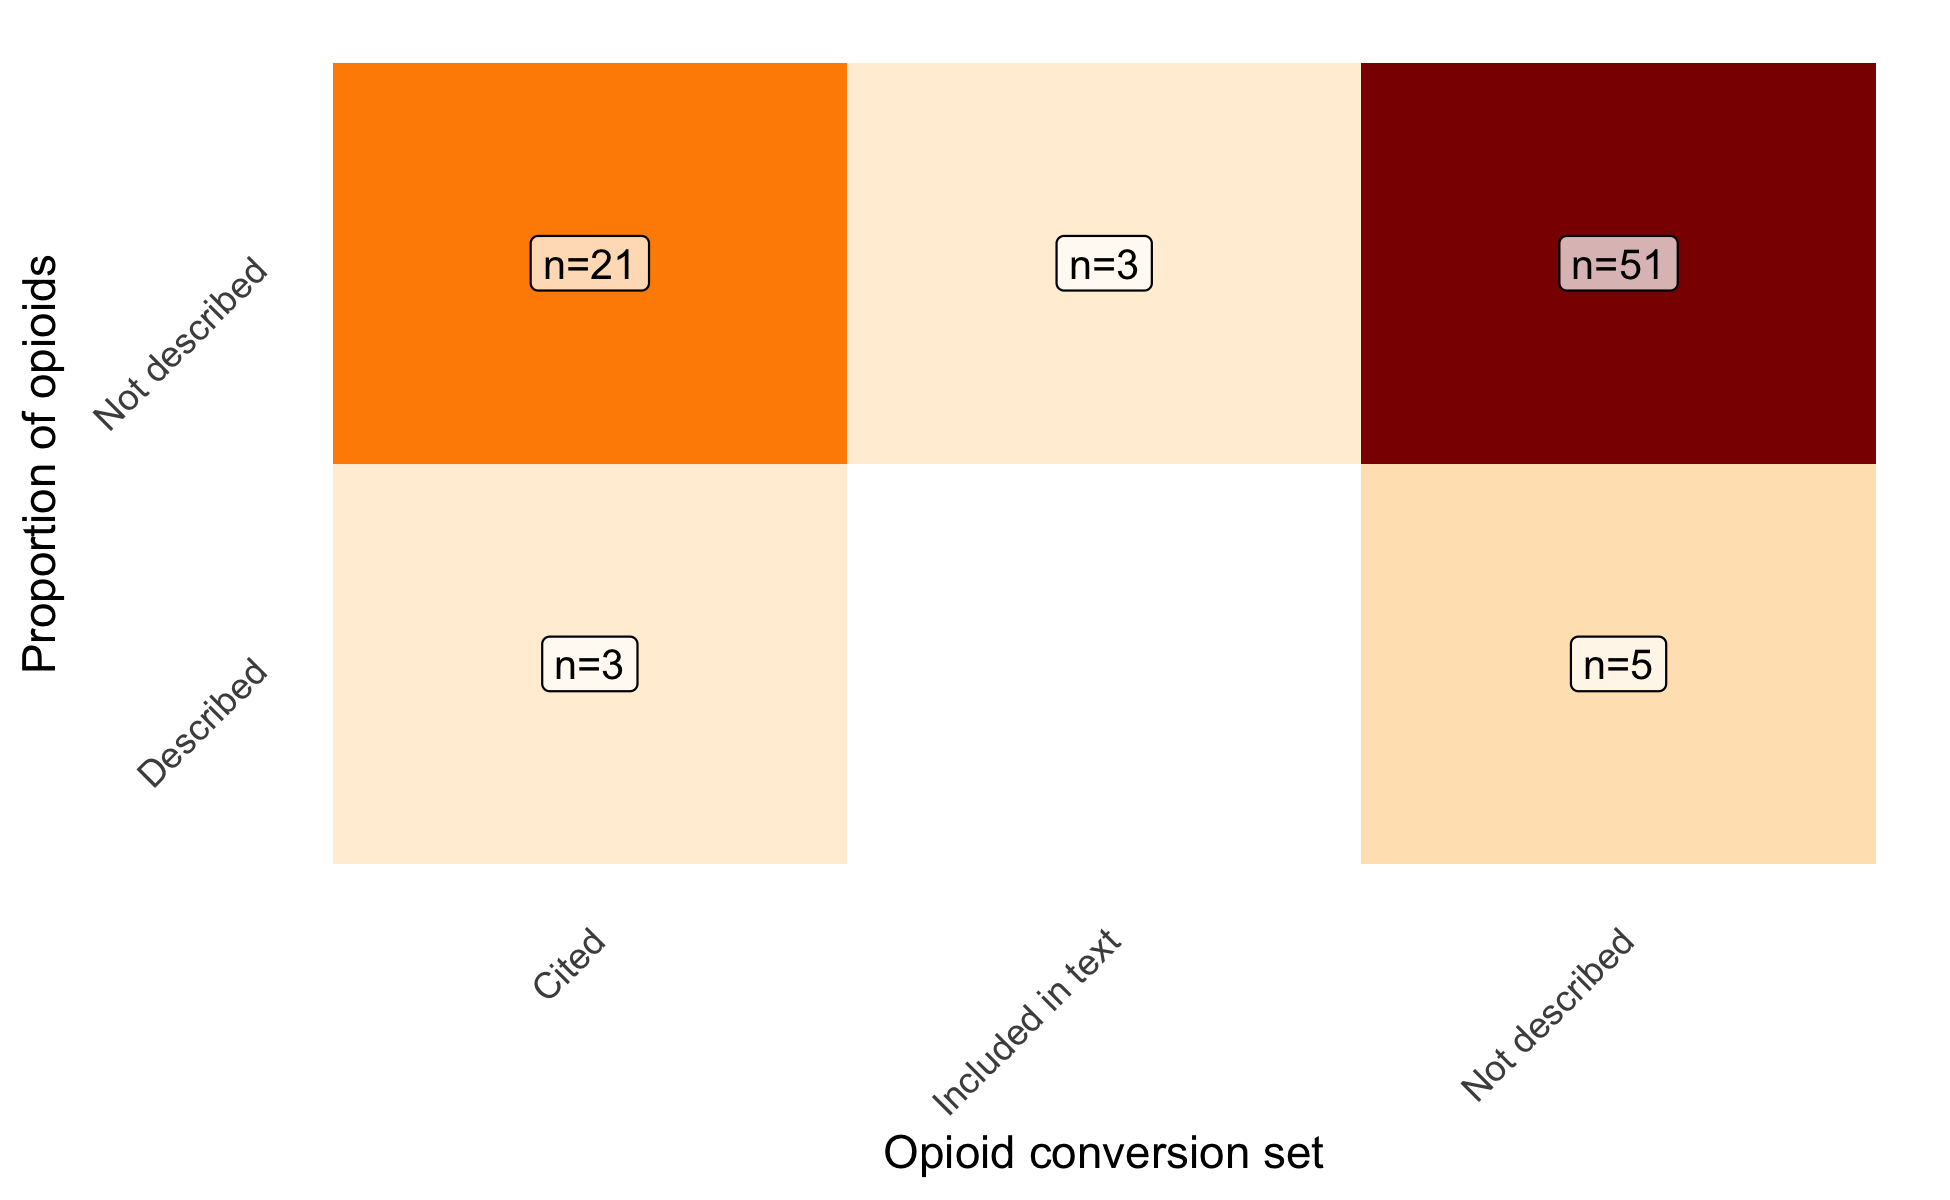
With regards to the opioid conversion sets used, 24 (29%) cited another source, whilst 3 (4%) included the conversion values within the paper. 56 (67%) papers did not include any citation or description of the opioid conversion sets used. 8 (10%) papers described the proportions of different opioids between intervention groups (Figure C.2). Of these 8 papers, 3 provided count data only and not mean/median dose for each opioid within treatment groups.
C.3.2 Impact of varying conversion values on studies
Table C.3 details the 5 studies where opioid proportions could be recovered. Of note, only Baran cited a opioid conversion set4, all other authors did not describe which value sets were used. Two studies were randomised controlled trials (RCT), whilst the remainder were retrospective cohort studies. With regards to the interventions analysed, in this subset, all were concerning analgesia either during or after the surgical procedure and were classed as anesthesia interventions.
| Authors | Title | Study design | Population | Control group | Intervention group | Opioid conversion set included |
|---|---|---|---|---|---|---|
| Baran 2025 | Optimizing Analgesia After Minimally Invasive Cardiac Surgery: A Randomized Non-Inferiority Trial Comparing Interpectoral Plane Block Plus Serratus Anterior Plane Block to Erector Spinae Plane Block. | RCT | Patients aged 18–75 years scheduled for their first minimally invasive cardiac surgery with ASA score I-III | Erector spinae plane block (ESPB) | ESPB plus Serratus anetrior plane block | Cited |
| Fedorka 20251 | Liposomal Bupivacaine + Bupivacaine Versus Bupivacaine Interscalene Nerve Block Effect on Pain After Rotator Cuff Repair: A Randomized Control Trial. | RCT | Adults undergoing arthroscopic rotator cuff repair with a planned interscalene nerve block | Bupivicaine | Liposomal bupivicaine | Not described |
| Carter 20252 | Inpatient Multimodal Pain Regimens Do Not Impact Hospital Length of Stay or Long-term Postoperative Opioid Use Following 1 and 2-Level Lumbar Fusion. | Cohort study | Patients aged18 or older who had undergone either a posterior lumbardecompression and fusion (PLDF) or transforaminallumbar interbody fusion (TLIF) from 2018 to 2019 | Opioid only postop analgesia | Multimodal postop analgesia | Not described |
| Hall 20253 | Ketamine as part of multi-modal analgesia may reduce opioid requirements following cardiac surgery: a retrospective observational cohort study. | Cohort study | Adult patients admitted for elective cardiac surgery | Standard postoperative analgesia | Postoperative analgeia with ketamine | Not described |
| 1 Median values provided, converted to means | ||||||
| 2 Paper divided into Tramadol OME and non-tramadol OME, Only other opioid, beside tramadol in the multi-modal group was oxycodone. Assumes IV for conversion value of oxycodone. Outcome extracted for total in-hospital OME. | ||||||
| 3 Outcomes for Dose in PACU and total in hospital | ||||||
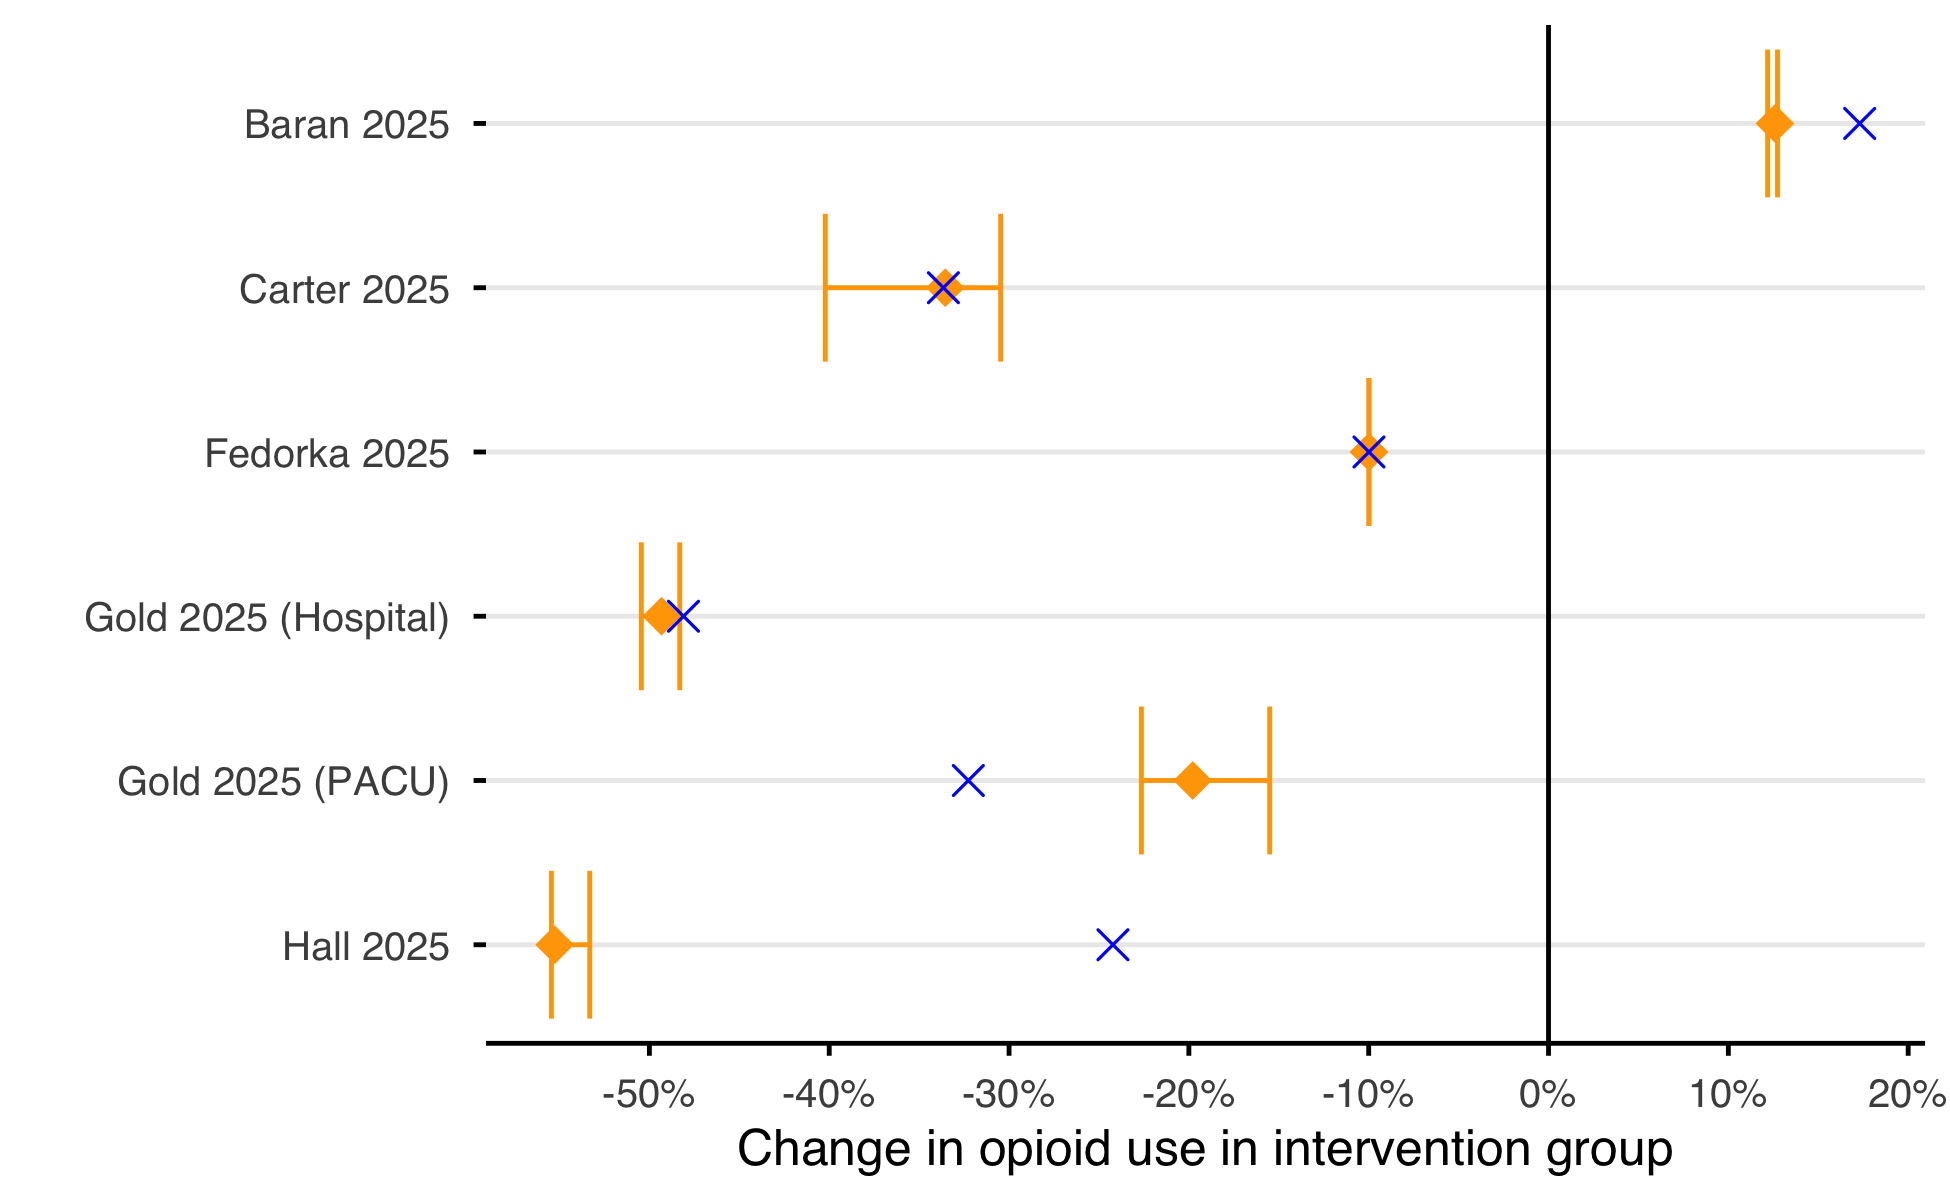
Table C.4 provides three sets of results for the studies detailed. The first is the study reported outcomes, this is the mean total opioid burden for the control and intervention groups. From this an observed difference is calculated with a percentage change from the control. The second column set is the de-novo calculation, by using the mean dose of each opioid within each group and conversion set provided (or Neilsens if not) to attempt to calculate the control and intervention group means. From these de-novo estimates a second difference of the treatment group was calculated.
Finally, regardless of the conversion sets used, the de-novo calculation was repeated across the possible grid values of the Neilsen conversion set. The minimum and maximum possible differences were then extracted.
| Authors |
Study reported outcome
|
De Novo calculated outcome
|
Range of estimates
|
|||||
|---|---|---|---|---|---|---|---|---|
| Control group | Intervention group | Difference | Control group | Intervention group | Difference | Lower bound | Upper bound | |
| Baran 2025 | 178.0 | 208.8 | 30.8mg (17.3%) | 182.1 | 205.1 | 22.9mg (12.6%) | 22.9mg (12.2%) | 68.8mg (12.7%) |
| Fedorka 2025 | 43.7 | 39.4 | -4.4mg (-10.0%) | 87.5 | 78.7 | -8.7mg (-10.0%) | -13.1mg (-10.0%) | -13.1mg (-10.0%) |
| Carter 2025 | 315.0 | 209.0 | -106mg (-33.7%) | 314.5 | 209.0 | -105.5mg (-33.5%) | -119.8mg (-40.2%) | -98.4mg (-30.5%) |
| Gold 2025 (PACU) | 164.6 | 111.5 | -53.1mg (-32.3%) | 36.8 | 29.5 | -7.3mg (-19.8%) | -10mg (-22.6%) | -4.6mg (-15.5%) |
| Gold 2025 (Hospital) | 107.8 | 56.0 | -51.9mg (-48.1%) | 218.8 | 110.9 | -107.9mg (-49.3%) | -114.3mg (-50.4%) | -101.9mg (-48.3%) |
| Hall 2025 | 118.9 | 90.1 | -28.8mg (-24.2%) | 149.1 | 66.7 | -82.4mg (-55.3%) | -82.6mg (-55.4%) | -81.5mg (-53.3%) |
This table highlights the difficulty in re-calculating the total opioid burdens that the authors have produced. This is likely due to a number of assumptions as details in the methods such as estimating mean values from medians and assuming medication routes. Only one study, Fedorka 2025, showed no sensitivity to the conversion value set used5. This is because, in the RCT only oxycodone was used in the post-operative period, as so whilst the group estimates may vary, the treatment effect percentage is fixed at 10%.
Figure C.3 demonstrates the reported difference in opioid burden (red cross) compared to the de-novo calculated difference (green cross). When the the grid search of the possible combinations of the values used by Neilsen was performed, the minimum and maximum values are demonstrated by the orange whiskers.
C.4 Discussion
There were some key learning points from the preliminary data collection that was integrated into the protocol as presented in Supplementary material D.
Search strategy - A single database was used for speed and ease, this was expanded to include 2 further databases sources.
Screening - A single reviewer with no verification was performed for speed and ease, a formal screening strategy was defined in the protocol. The inclusion criteria was narrowed to only include interventional study, this was due to a number of non-comparative observational trials being included in the primary data extraction. The full text screening stage was integrated into the primary data extraction in the proforma.
Data extraction - The primary and secondary data collection proformas were formalised in the protocol. For each field a descriptor was included to further define the value to be entered. The primary data collection proforma was focused to remove data points that were deemed no longer required.
Analysis plan - The analysis plan was formalised and analysis script defined.